I got into virtual photography recently: taking photos inside video games. Like any beginner, I started pushing sliders. Exposure, Brightness, Levels, Curves. Everything made my dark screenshots lighter, so I assumed they were more or less the same thing with different names. At some point I was using gamma because I was told to, and Brightness because it was right there.
My story: how I got into in-game photography
This part is personal and not needed for the rest of the article, so feel free to skip it.
I had a few screenshots that I thought were cool, and instead of letting them collect dust I wanted to share them on Instagram.
That’s how I discovered a huge community of in-game photographers. And I realized that people almost never post raw captures. There is always some post-processing involved, and everyone is trying to give their photos a certain look. I wanted to learn to do that too! That’s when I started digging.
I decided to learn editing properly, and I started digging into the tools and techniques with Claude. Very quickly I realized how much I don’t understand about digital photography. I had no idea how the tools work on a fundamental level.
Learning by doing plus books used to be my main way to learn anything. This time Claude is my main companion instead, because AI has become smart enough that I wanted to see how far it can take me. The price is that I can’t know for sure that everything I learn this way is right. For now, I am willing to take that risk.
I did look into a few books and video tutorials, but most of them are based on vibes: push this slider until it feels right. They don’t really teach the fundamentals. I come from a technical background, and I can’t just rely on vibes. I need to understand how things work.
That need to understand is how this article happened.
I think I will write another article about the whole journey at some point: the community, my Instagram channel, and everything I had to learn about how Instagram works (reels, carousels and the infamous “algorithm”).
Then I got curious and decided to measure what these sliders actually do. In this article I want to share what I found in Affinity Photo 3. Some of it surprised me.
A word on how I am learning this. My main companion on this journey is Claude, an AI, and I don’t have a textbook to check it against. That is why I measured things myself instead of just asking, and why the disclaimer below matters.
Disclaimer: I’m still learning photography. Everything below comes from my own tests, run with Claude or under Claude’s guidance, on one computer, in Affinity Photo 3, with 8-bit sRGB images. Other versions or other apps may behave differently, and I may have gotten something wrong.
You can play with every number in this article. The small widgets are real: they do the same math I measured. And if you are too lazy to read (no judgment) and just want to play with the sliders, I made a dedicated page with all the widgets and a short note on what each one shows.
Where it gets technical, there is a collapsed For nerds box. You can skip them and the article still works. Those parts were explained to me by Claude (an AI), not measured by me, and each box says where it comes from.
Key takeaways:
- A pixel is not light. Each pixel is three numbers from 0 to 255 (red, green and blue). A stored 128 is only about 22% of the light of 255.
- Exposure multiplies each channel’s stored value by about 1.37 per stop and cuts off anything above 255. When one channel clips first, the color shifts: orange turns yellow.
- Brightness is a curve that keeps black and white where they are, lifts the middle and squeezes the highlights. It bends colors as it goes, and every app has its own version.
- Both work on each channel separately, which is why colors move when you push them.
- What I use: Levels gamma or Curves to lift a dark 8-bit screenshot. In an app with only Exposure and Brightness, Exposure for dark images and Brightness for ones with bright areas. Exposure is the one for RAW or HDR files, but I don’t work with those.
The photo, and two sliders I couldn’t tell apart
Here is the photo I’ll use in this article. It’s a screenshot from Cyberpunk 2077: Phantom Liberty, taken on a PS5 in photo mode with no filters. It’s very dark, which makes it a good test.
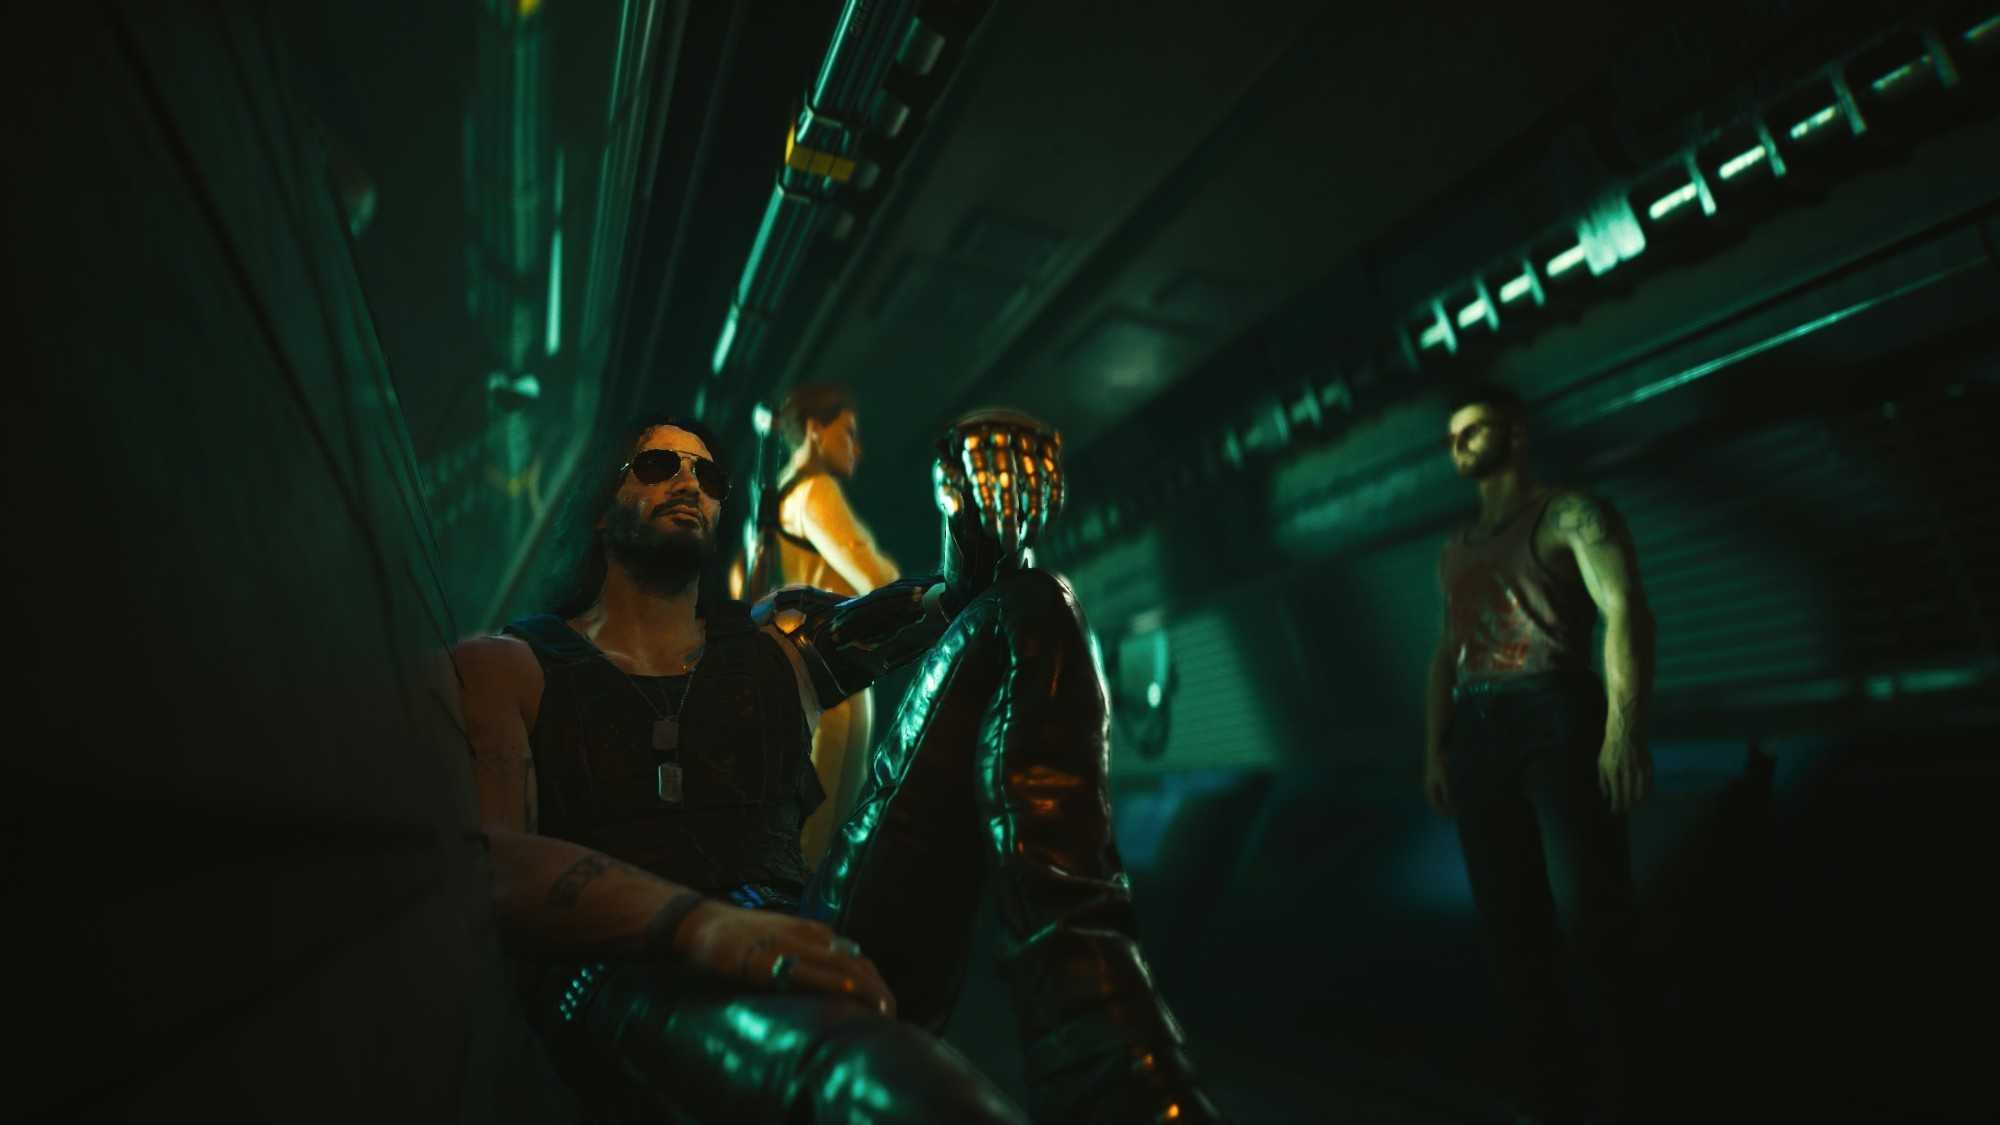
Cyberpunk 2077: Phantom Liberty, © CD Projekt Red. Unedited PS5 photo mode capture.
Affinity Photo has two sliders that both make it lighter: Exposure and Brightness. Before any theory, play with them. There are no curves and no histograms here, just the photo and the two sliders.
Did you notice the difference? I didn’t, at first. Both make the picture lighter, and what separates them is subtle: how the bright parts behave, and how the colors shift on the way. Yet they sit right next to each other in Affinity Photo, as if they were two different tools. I was very confused. Which one should I use, and when?
I couldn’t answer that by moving the sliders. To pick one, I needed to understand the math behind each. That is how this article started.
Later I found out that Brightness is a legacy tool. Lightroom removed it years ago (more on that near the end). But I work in Affinity and in other free apps, and they still have Brightness as a separate knob, so the question stays real for me. If you edit in one of those, it might for you too.
Two words, many meanings
“Brightness” and “exposure” sound familiar because we use them every day.
On a phone or a TV, brightness is how strong the backlight is. In a photo editor from a few years ago, it is a slider that makes the picture lighter or darker. On Instagram and in the iOS Photos app it is still there.
Exposure is a camera word. It is how much light reaches the sensor (or the film), and it depends on the aperture, the shutter speed and the ISO. In physics it is light multiplied by time. A “stop” of exposure means twice as much light.
In a photo editor, the Exposure slider tries to do what the camera would have done if you had let in more or less light. Brightness just makes the picture lighter. These two behave differently, as we’ll see.
A pixel is not light
Before we touch any slider, there is one thing that confused me for a long time: what is actually inside an image file.
A normal JPEG or PNG (and a game screenshot) stores each pixel as three whole numbers, one for red, one for green and one for blue. Each goes from 0 to 255. These are the stored values. For example:
0 · 0 · 0is black and255 · 255 · 255is white.128 · 128 · 128is a middle gray.224 · 140 · 9is the orange glow on the hand in the photo above: a lot of red, some green, almost no blue.
Those numbers are what the file contains, and what every slider in an editor changes. But they are not amounts of light. A gray with the stored value 128 is not “half as much light as white”. It is much less than half.
I always imagined the values stored in the R, G and B channels as light intensity, and I thought they would translate to lightness in a linear fashion: twice the number, twice the light. It turned out this is not the case. Finding that out opened a Pandora’s box of color profiles and color spaces that I couldn’t close again. Maybe I’ll write about it next time.
Roughly, the light is the stored value (as a fraction from 0 to 1) to the power of 2.2. That 2.2 is the “gamma” of the sRGB standard, which almost every screenshot and JPEG uses. Drag the slider and watch the second line.
A few examples, so it sinks in:
- Stored 128 is only about 22% of the light of white.
- Stored 64 is about 5%. Doubling the number from 64 to 128 gives about 4.6 times more light, not 2 times.
- To get 50% of the light you need to store 186, not 128.
- To double the light of a mid gray (one stop, which we’ll meet in a minute) you have to go from 128 to about 175. For a dark pixel the same doubling is a much smaller step: 51 becomes 70.
Why would a file do this? Our eyes are much more sensitive to differences in dark tones than in bright ones. That’s also why we all love OLED displays: they give you “blacker” blacks. A file only has 256 values to spend, so the numbers are spent where we notice them. Half of all the values (0 to 128) describe the darkest 22% of the light. If the numbers were plain amounts of light, those shadows would get only 56 values and you’d see ugly steps in dark areas.
It is a clever trick, but it has a side effect: doing math on the stored numbers is not the same as doing math on light. Adding 20 to a dark pixel (30 to 50) triples its light, even though it hardly looks brighter, while adding 20 to a bright one (200 to 220) adds only about a quarter. This is where exposure and brightness part ways: Brightness works on the stored RGB numbers, while Exposure uses clever math on them to mimic physical light.
Try it yourself. Both pixels get the same number added, and the readout shows how many times more light each one gets.
Pro Tip: When you brighten a photo, watch the highlights first. Dark values have plenty of room, but light ones run into 255 and turn white quickly.
For nerds: the real sRGB curve
Claude explained this to me. The full definition is on Wikipedia.
I said the light is the stored value to the power of 2.2. That is the short version. The real sRGB rule has two parts. Take the stored value s as a fraction from 0 to 1:
- Up to
s = 0.04045(a stored value of about 10):light = s / 12.92. A straight line. - Above that:
light = ((s + 0.055) / 1.055) ^ 2.4.
The second part has an exponent of 2.4, but with the offsets it behaves overall like a power of about 2.2, which is why “gamma 2.2” is the usual nickname.
Here are both curves. Over the whole range they are almost the same line. Slide left to zoom into the darkest tones, where they part.
The straight piece near black is there for a technical reason. A pure power curve is extremely steep at zero when you go from light back to stored values, so a tiny bit of noise in the shadows would turn into a big jump. The straight piece avoids that.
The curve is usually explained as a leftover from CRT monitors, whose brightness followed roughly a power of the input voltage. Encoding files with the opposite curve canceled it out, and as a bonus it spends the 256 values where our eyes are most sensitive.
Exposure: multiply the light
In Affinity Photo 3, Exposure is a single slider.
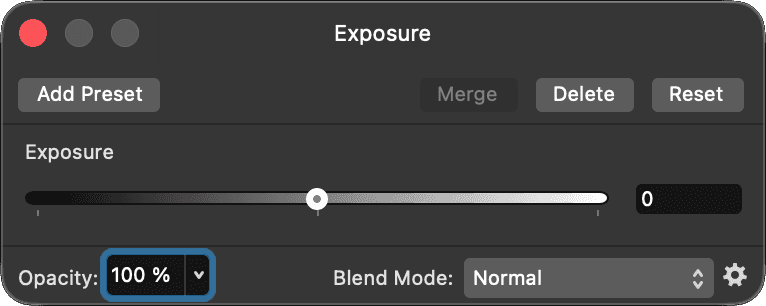
Affinity Photo 3, Exposure adjustment.
One stop of exposure doubles the light. Since light is the stored value to the power of 2.2, doubling the light multiplies the stored value by 2 to the power of 1/2.2, about 1.37. That is what I measured in Affinity Photo 3: for every channel,
new value = old value × 2^(EV / 2.2)
and anything above 255 is cut off at 255. I checked it against exports of a test image and it matched within about 2 values out of 255 (more about how I measured it at the end).
This is a plain power of 2.2, which is a small simplification. The exact sRGB curve has a short straight piece near black, and following it would give a few values more in the deepest shadows (one stop on a stored 10 would give 18 instead of 14). Affinity’s numbers matched the simple formula, so that’s what it seems to use. From the mid-tones up the two agree within a value or two.
For nerds: where a stop is not exactly a stop
This one is from Claude, and I have no source for it. The numbers come from the sRGB formulas in the box above.
A camera records linear light, where one stop is simply “times 2”. The textbook way to do that in an editor is: turn the stored values into light with the sRGB rule, multiply by 2 for each stop, and turn them back into stored values. What Affinity’s numbers match is a shortcut: multiply the stored values directly by 2^(1/2.2) ≈ 1.37. The two are the same only if the encoding is exactly a power of 2.2.
Here is one stop both ways:
| Stored value | Exact sRGB | Affinity (× 1.37) |
|---|---|---|
| 5 | 10 | 7 |
| 10 | 18 | 14 |
| 20 | 31 | 27 |
| 30 | 45 | 41 |
| 100 | 138 | 137 |
| 128 | 176 | 175 |
They only come apart in the deepest shadows. A stored 10 becomes 14 with the shortcut, which is about 1.4 times the light instead of 2 times. Values that low are almost black, and in an 8-bit file they are mostly noise and banding anyway, so I wouldn’t worry about it.
Let’s start with one pixel from the orange glow on the hand in the photo, a very saturated color. Move the slider up.
The red channel hits 255 before you even reach +0.5 stop, and then it has nowhere to go while green and blue keep growing. That’s clipping. And because only one channel clipped, the color changes: the orange becomes more and more yellow. At +2 stops it is 255 · 255 · 17, pure yellow. The hue went from 37° to 60° just by “making it brighter”.
The same happens with other colors, only with another channel. The teal of the pipes (this one is close to it) has green and blue high, so green clips first and the color slides toward cyan and then white.
Now the whole photo. The histogram shows how many pixels have each brightness, from black on the left to white on the right. The small plot is the curve: input on the horizontal axis, output on the vertical one. For exposure it is a straight line that hits the ceiling and goes flat. Look at “Clipped pixels” as you drag.
Pro Tip: On an 8-bit file, Affinity’s Exposure gives the same pixels as moving the white point in Levels (when you brighten, within the noise of my measurement). It’s a straight stretch of the values with a camera-style name. For +1 stop, set White Level in Affinity’s Levels panel (shown further down) to 73%, which is 186 out of 255, or 255 ÷ 1.37. If an editor has no Exposure slider, this is the same thing.
Where Exposure really pays off, as far as I understand, is RAW files. A RAW file keeps light beyond what the screen can show, so you can pull the highlights back. A game screenshot has none of that: the clipped values are already gone.
Brightness: a curve with fixed ends
Now Brightness. I was convinced it was just gamma. It isn’t, and it’s hard to find out how it works, because there’s no standard. Every app picks its own curve. So I measured Affinity’s.
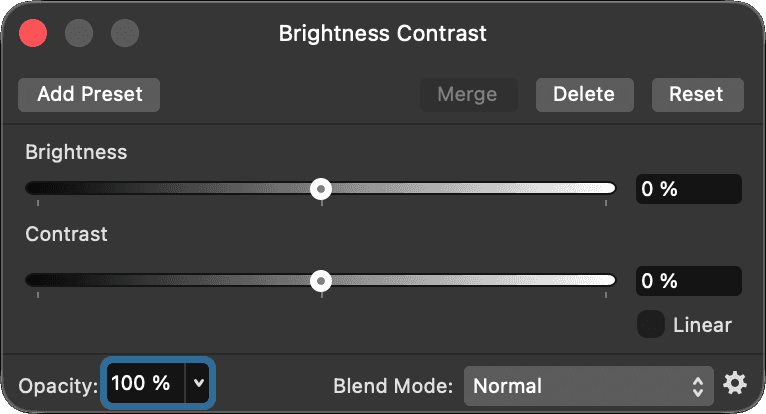
Affinity Photo 3, Brightness Contrast adjustment. I only measured the Brightness slider and the Linear checkbox.
The method was simple: I made an image with all 256 grays, applied Brightness at -100, -75, … +100, exported each one and read the values back. That’s why the widgets below only offer these nine positions: I didn’t want to show you numbers I never measured.
Here is the same orange pixel.
What I noticed:
- Black stays black and white stays white, at every setting.
- It lifts the middle most. At +50 the mid gray 128 becomes 185.
- The shape changes when you drag. Where the lift is strongest moves toward the shadows as you go up, so it isn’t a single curve that just gets stronger.
- Colors still move. The orange slides toward yellow here too (37° at 0, 52° at +75), and the red barely reaches 253 there. The dim channels get lifted more than the bright one, so the proportions change.
- It clips too, just later and softer than Exposure. At +25 the top few values (253 and up) already become 255, at +50 it’s 247 and up, and at +100 everything from 202 up.
Mostly it squeezes the highlights together instead of cutting them off. At +75, for example, everything from 200 up ends up between 250 and 255.
And here is the whole photo.
Affinity also has a “Linear” checkbox in the Brightness Contrast panel (under the Contrast slider). I measured it too: it’s just value + 2.55 × slider, a flat offset, clipped at 255. Black turns gray. I’d skip it.
To put the two side by side, here is one photo with both sliders. They’re separate on purpose: there’s no fair way to say “Brightness 30 equals Exposure 0.7”, because they are different curves.
One curve, three channels
I skipped over something important: both sliders work on each color channel separately. The red, green and blue values of a pixel each go through the same curve. Affinity never looks at the color as a whole.
I checked this. I put eight color squares in my test image, applied the adjustment and compared them with what the gray curve predicted for each channel on its own. For Exposure and for Brightness (at all eight settings from -100 to +100) the difference was at most 2.5 values out of 255, which is just the noise in my measurement. So the curve you see in the widgets is applied three times, once per channel.
Why do I care? Two reasons.
First, clipping happens per channel. A pixel doesn’t “become too bright”. One of its channels reaches 255 first and stops, and the other two keep going. That’s why the orange turned yellow and the teal turned cyan. The “Clipped” line in the widgets tells you which channel stopped.
Second, the shape of the curve decides what happens to your colors. Take a dark teal, 51 · 80 · 92. Exposure only multiplies, so every channel grows by the same factor and the proportions between them stay the same (until something clips). At +1 stop it’s 70 · 110 · 126, and the hue doesn’t move and the saturation (HSL) stays at 29%.
Brightness bends the values instead of scaling them, and a bend lifts a dark channel more than a bright one. The proportions change, and so does the color. The same teal at +50 is 86 · 128 · 143 and the saturation (HSL) drops from 29% to 25%. At +100 it’s 151 · 198 · 211, and the saturation goes up to 41%. Nothing clipped there, the color just moved.
Exposure keeps the proportions between the channels, so the hue holds until something clips. Brightness changes the color by bending the curve. Either way, it’s worth looking at a neon sign or a skin tone after you touch one of them.
One caveat about saturation numbers: HSL measures saturation against how close the color is to white or black. A color that starts just below mid gray, like 100 · 130 · 150, goes from 20% to 41% saturation at +1 stop of Exposure (137 · 178 · 206), with the same hue and the same proportions between the channels. It crossed mid gray on the way up. My dark teal above stays well below it, so nothing happens there. Don’t read too much into a saturation number on its own.
For nerds: why HSL saturation moves when you only scale
From Claude. The definitions are on Wikipedia’s HSL and HSV page.
Take max and min as the biggest and smallest channel (as fractions from 0 to 1) and the lightness L = (max + min) / 2. HSL saturation is (max − min) / (1 − |2L − 1|), and the bottom part changes shape at mid gray:
- At
L ≤ 0.5it is(max − min) / (max + min). Multiply all channels by the same number and it cancels out, so the saturation stays put. That is the dark teal staying at 29%. - Above
L = 0.5it is(max − min) / (2 − max − min). Multiplying makes the top bigger and the bottom smaller, so the saturation climbs.100 · 130 · 150hasL= 0.49 and 20%. After one stop,137 · 178 · 206hasL= 0.67 and 41%.
HSV saturation, (max − min) / max, doesn’t change when you scale. So which model a program shows you decides whether Exposure “changes saturation”. Neither is a measure of how saturated a color looks.
Two limits. I only used color squares for these two tools. I measured gamma on grays only, so I expect Levels in its normal RGB mode to behave the same way, but I didn’t check. And every tool I measured works per channel. Tools that work on lightness only (an HSL or Lab based adjustment, for example) should leave the hue alone, but I didn’t test any of those in Affinity, so I can’t tell you how they behave.
What to use instead of Brightness
Brightness is quick, and for a small nudge it’s fine. But I don’t love that it’s a black box: another app has a different curve, so a recipe like “Brightness +30” doesn’t carry over. Two options where you know exactly what happens:
- Levels, Gamma slider. One number, and the curve is simple:
new value = old value ^ gamma. In Affinity, a gamma below 1 makes the picture lighter. Careful, in Photoshop it is the other way around. It keeps black and white fixed and it is predictable, which is why I use it for dark scenes. - Curves. When you want to lift only the shadows, or protect the highlights, draw the curve yourself. It takes some practice, but you decide exactly what happens. Curves in its normal RGB mode should work per channel too, so it can nudge colors as well. A trick for that is to set the Curves adjustment layer to the Luminosity blend mode, so the change should only affect lightness and not color.
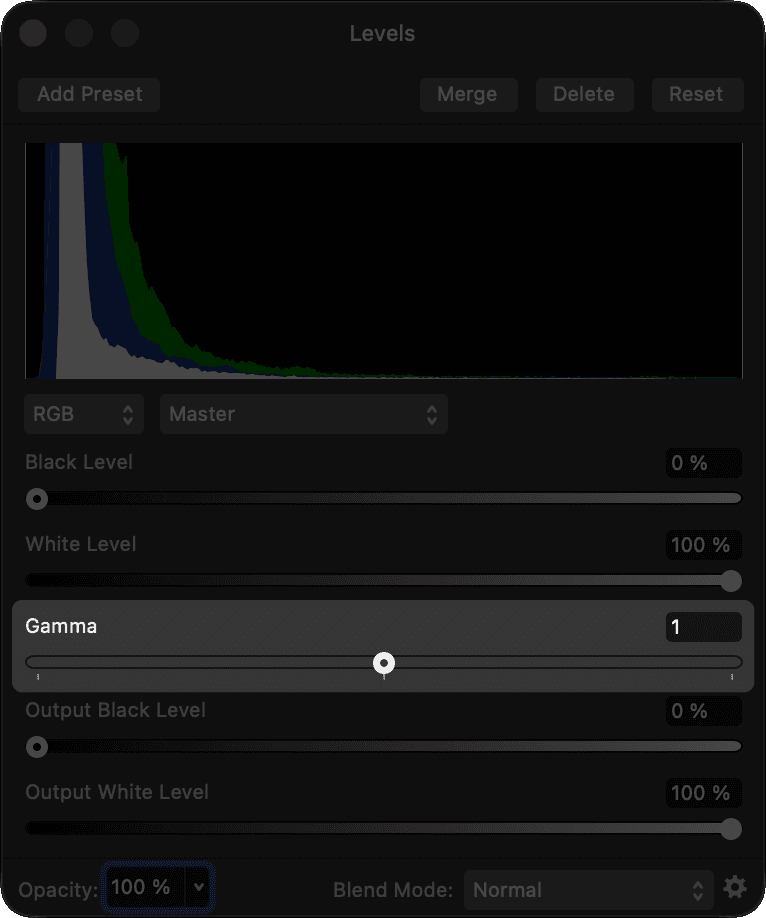
Affinity Photo 3, Levels adjustment (RGB, Master). Gamma, highlighted, is the slider I use, and 1 means no change.
Try gamma on a dark pixel from the wall. Going below 1 lifts it.
And on the photo:
I left out gamma 0. In Affinity it turns the whole picture white.
Looking at the curves, I noticed that these three don’t push the same tones. To compare them fairly, I picked a setting of each that lifts a mid gray (128) by about the same amount, and checked where they differ:
| Stored value | Exposure +1 | Brightness +50 | Gamma 0.5 |
|---|---|---|---|
| 32 | 44 (+12) | 56 (+24) | 90 (+58) |
| 64 | 88 (+24) | 105 (+41) | 128 (+64) |
| 128 | 175 (+47) | 185 (+57) | 181 (+53) |
| 192 | 255 (+63) | 235 (+43) | 221 (+29) |
| 224 | 255 (+31) | 249 (+25) | 239 (+15) |
The number in brackets is how much the value went up. It’s the same picture, but with three different shapes:
- Exposure lifts the highlights the most. The brighter the tone, the bigger the lift, until it hits 255 and gets cut off. That’s why it clips so easily.
- Gamma is the opposite: it lifts the shadows the most. The peak is around 60 out of 255, and it fades toward white. At 224 it adds only 15.
- Brightness sits in between. Its lift peaks in the mid-tones (around 115 at small settings, sliding down toward 90 at +100). It’s harder on the highlights than gamma and gentler than exposure, because it squeezes them against 255 instead of cutting them off.
To sum it up: Exposure pushes the highlights hardest, Gamma pushes the shadows hardest, and Brightness peaks in the mid-tones, somewhere in between. That’s why I use gamma for dark screenshots: it opens up the shadows without pushing the bright parts into white.
What the other editors do
Brightness has disappeared from most serious editors. Lightroom removed it in Lightroom 4 (Process Version 2012), together with Recovery and Fill Light, and added Highlights, Shadows and Whites. I could not find an Adobe page that says why, so these are third-party sources: Peachpit, a Cambridge in Colour forum thread (people there say the old Exposure and Brightness sliders did an overlapping job) and Laura Shoe’s guide.
I also looked at LightCraft, a new open-source Lightroom-style editor. It has an Exposure slider from -5 to +5 stops (controls.rs), and no plain Brightness slider in its normal Light section, only Contrast, Highlights, Shadows, Whites and Blacks. In its shader, the local exposure is a multiplication of the color by exp2(stops) (finish.wgsl), which is the “double the light per stop” idea in one line. I didn’t trace how the global slider is applied, so I won’t claim more than that.
Instagram and the iOS Photos app still have Brightness. I didn’t measure them, so I can’t tell you what their curves look like. I may test them at some point.
So, which one should I use?
This is what I do now. Remember that it is my opinion, based on 8-bit game screenshots.
- 8-bit screenshot, too dark: lift with Levels gamma or Curves. They open up the shadows and squeeze the highlights instead of burning them.
- Instagram or the iOS Photos app: reach for Shadows (and Highlights) before Exposure or Brightness. As Apple describes them, these sliders only touch the dark or the bright part of the picture, which is what a dark photo needs. I didn’t measure them.
- An app with only Exposure and Brightness: for a dark photo, try Brightness first. In my table above, at a similar lift of the mid gray, it raises a dark tone like 32 twice as much as Exposure does (+24 against +12) and it clips later. Exposure makes sense when the whole picture is dark and nothing in it is near white. I only measured Affinity’s, so for other apps this is an educated bet.
- 8-bit screenshot, too bright: Exposure is fine. Going down never clips, but your whites turn gray.
- RAW or HDR file: start with Exposure. There is room above white, so it is safe, and it behaves like the camera would have. I don’t work with RAW myself, so this one is theory.
Pro Tip: If a bright neon sign turns yellow when you brighten a photo, one channel clipped. Go back and use gamma or Curves instead.
I didn’t test what Exposure does in 16-bit or 32-bit documents, so I can’t say anything about those.
How I measured this
If you want to repeat it: I made an image with 256 gray squares (value 0 to 255) plus a few color squares. I applied one adjustment at a time in Affinity Photo 3, exported a PNG, and read the exact values back with a small script. Exporting the untouched image gave values that were off by about 1, so treat every number here as accurate to about 2 out of 255.
I think there is more to find in how Affinity handles Contrast and bit depth. Maybe next time.